SCALING LAWS AND ISOMECHANICAL GROUPS
18.1 The Normalization of Mechanical Data
18.2 Empirical Normalization of Data
18.3 Normalization of Constitutive Laws
18.4 Isomechanical Groups
AN INESCAPABLE conclusion of Chapters 4 to 16 is that materials with the same crystal structure and similar bonding have similar deformationmechanism diagrams. When plotted on the normalized axes σs/μ and T/TM, the maps for all f.c.c. metals, each fitted to experimental data, have an almost identical disposition of fields and of strain‑rate contours. Further, they are clearly differentiated from the b.c.c. metals, or the alkali halides, or the various classes of oxides, each of which has its own characteristic map.
Polycrystalline solids, then, can be classified into isomechanical groups by properly normalizing the data for them; the members of one group have similar mechanical properties, and are differentiated by the normalization from members of other groups. We now examine how best to normalize data to bring out the similarities and differences between materials. From this we derive the preliminary classification of materials into isomechanical groups given in Table 18.1.
TABLE 18.1 Isomechanlcal groups
|
Crystal system |
Structure type |
Point groups |
Isomechanical group |
|
Cubic |
F.C.C. |
m3m F |
Al, Cu, Ag, Au, Pt, Pb, Ni, γ‑Fe |
|
|
Diamond cubic |
m3m F |
C, Si, Ge, α‑Sn |
|
|
Rock salt: |
m3m F |
|
|
|
Alkali halides |
|
(K, Na, Li, Rb)(F, Cl, Br, I) AgCl, AgBr |
|
|
Simple oxides |
|
MgO, MnO, CaO, CdO, FeO, CoO |
|
|
Lead sulphide |
|
PbS, PbTe, etc. |
|
|
Metal carbides |
|
TiC, ZrC, UC, TaC, VC, NbC |
|
|
Fluorite |
m3m F |
UO2, ThO2, CaF2, BaF2, CeO2 |
|
|
Spinel |
m3m F |
MgAl2O4, etc. |
|
|
B.C.C.: |
m3m I |
|
|
|
Alkali metals |
|
Li, Na, K, Cs, Rb |
|
|
Transition metals |
|
W, Ta, Mo, Nb, V, Cr, α‑Fe, δ‑Fe, β‑Te, β‑Ti, β‑Ze, Eu, Er |
|
|
Rare earths |
|
γ‑U, ε‑Pu, δ‑Ce, γ‑La, γ‑Yb |
|
|
Caesium chloride |
m 3m P |
CsCl, CsBr, LiTl, MgTl, TlI, AuZn, AuCd, NH4Cl, NH4Br |
|
|
Zinc blende |
|
α‑ZnS, InSb, β‑SiC, AlAs, AlSb, GdSb, GaSb, BeS, HgS, AlP, BeTe |
|
Tetragonal |
β‑Sn |
4/mmm I |
β‑Sn |
|
|
Rutile |
6/mmm P |
TiO2, SnO2, PbO2, WO2, MnO2, VO2, NbO2, TaO2, MgF2, etc. |
|
Hexagonal |
Zinc |
6/mmm P |
Cd, Zn, Co, Mg, Re, Te, Be, Zr, Ti, Hf, Y, Gd, Dy, Ho, Er |
|
|
Wurtzite |
6/mmm |
ZnO, BeO, β‑ZnS, β‑CdS, α‑SiC, AIN, InN |
|
|
Graphite |
6/mmm |
C |
|
|
Ice |
6/mmm |
H2O |
|
Trigonal |
α‑Alumina |
|
α‑Al2O3, Cr2O3, Fe2O3 |
|
|
Bismuthe |
|
Bi Sb, As, Hg |
| 18.1 THE NORMALIZATION OF MECHANICAL DATA |
The maps of this book are plotted on normalized axes of σs and T/TM. This is a common choice for presenting mechanical data; but what are the grounds for selecting it? There are two complementary ways to study the problem of revealing the intrinsic similarities and differences between groups of materials. First, a purely empirical approach: if the data for a group of materials, when normalized, are brought onto a single master curve, and separated in this way from data for other groups of materials, then the normalization is a successful one. We examine this approach in Section 18.2. Second, a method using the model‑based constitutive laws: if a constitutive law is to be normalized such that data for a group of materials in the same structural state lie on a single master curve, then certain dimensionless combinations of material properties must be constant for that group. This approach, which gives a basis for dividing materials into isomechanical groups, is developed in Section 18.3.
Let the normalizing
parameter for stress be called
σ*, that for temperature T*, and that for strainrate ![]() There are three
obvious groups of normalizing stresses
σ* (Table 18.2). The first are moduli, suggested by dislocation theory:
shear moduli μ,
Young's modulus E, and the bulk modulus K (because dislocation
energies and line tensions depend on these). The second are based on energies
and are suggested by microscopic models for the lattice resistance and for
diffusion: the cohesive energy
∆Hc, the energy of fusion
∆Hf and the energy of sublimation
∆Hυap, each divided by the atomic or molecular volume,
Ω, so that
σ* =
∆Hc/Ω, etc. Finally, there are
normalizing parameters based on temperatures:
σ* = kTM/Ω where k is Boltzmann's
constant and Ω is the atomic or molecular volume. The
boiling point TB and the Debye temperatures Tθ can also be treated in this way.
There are three
obvious groups of normalizing stresses
σ* (Table 18.2). The first are moduli, suggested by dislocation theory:
shear moduli μ,
Young's modulus E, and the bulk modulus K (because dislocation
energies and line tensions depend on these). The second are based on energies
and are suggested by microscopic models for the lattice resistance and for
diffusion: the cohesive energy
∆Hc, the energy of fusion
∆Hf and the energy of sublimation
∆Hυap, each divided by the atomic or molecular volume,
Ω, so that
σ* =
∆Hc/Ω, etc. Finally, there are
normalizing parameters based on temperatures:
σ* = kTM/Ω where k is Boltzmann's
constant and Ω is the atomic or molecular volume. The
boiling point TB and the Debye temperatures Tθ can also be treated in this way.
Table 18.2 also lists normalizing parameters T* for temperature: they, too, can be based on the same three groups of material property used with stress, although, of course, the normalizing temperature must have the dimensions of temperature. First there are temperatures: TM, TB and Tθ. Then there are temperatures based on energy divided by the gas constant: ∆Hc/k, for example. Finally there are temperatures based on moduli: μΩ/k, for instance.
The normalization of the
strain‑rate is less obvious. In Section 18.3 a natural normalization
appears: it is ![]() where
where
![]() is the
melting point diffusivity and
Ω the atomic or
molecular volume. It will be justified later.
is the
melting point diffusivity and
Ω the atomic or
molecular volume. It will be justified later.
The idea of normalizing
mechanical data is not new. Dorn (1957) [1], McLean and Hale (1961) [2], Bird et al. (1969) [3], Sherby and Burke (1967) [4], Kocks et al. (1975) [5], Sherby and Armstrong (1971) [6] and Chin et al. (1972) [7] advocate, variously, the use of
μ, E and c44 to
normalize flow stress and hardness. The melting point, TM, is
widely used as a normalizing parameter for temperature (Sherby and Simnad, 1961
[8]; Sherby and Burke, 1967 [4]) although without convincing physical just)fication;
by contrast, there are good physical grounds for using
μΩ/k (Kocks et al., 1975) [5]. The normalization ![]() (where D is the lattice
diffusion coefficient) has been suggested for strainrate (Sherby and Burke,
1967) [9], although this quantity is not dimensionless. Ashby
and Frost (1975) [10] use instead the dimensionless quantity
(where D is the lattice
diffusion coefficient) has been suggested for strainrate (Sherby and Burke,
1967) [9], although this quantity is not dimensionless. Ashby
and Frost (1975) [10] use instead the dimensionless quantity ![]() , as we do
here.
, as we do
here.
There have, then, been numerous attempts at normalization. But only one systematic study has been undertaken: that reported by Brown (1980) [11] and Ashby and Brown (1981) [12]. In the rest of this chapter we follow their approach, and examine the success or failure of applying the normalizing parameters of Table 18.2, in the two ways described earlier.
TABLE 18.2 Normalizing parameters
|
Normalizing stress σ* (N/m2) |
Normalising temperature T* (K) |
|
Modulus‑based |
Temperature‑based |
|
|
TM = Melting point |
|
μ' = Polycrystal shear modulus |
Tθ = Debye temp. |
|
μ'' = c44 |
TB = Boiling point (or sublimation temperature) |
|
E = Young's modulus |
|
|
K = Bulk modulus |
|
|
|
|
|
Energy‑based |
Energy‑based |
|
|
|
|
|
|
|
|
|
|
|
|
|
Temperature‑based |
Modulus‑based |
|
|
|
|
|
|
|
|
|
k = Boltzmann's constant
Ω = Atomic or molecular volume
The maps of this book are based on experimental data, much of which are plotted on the maps themselves or on separate data plots. The striking similarity between the data plots for the b.c.c. transition metals of Chapter 5, for instance, confirms that the normalization σs/μ and T/TM has some merit in revealing intrinsic similarities and differences between materials. But the data on these plots derive from many different investigators each applying different techniques to samples of differing purity; the inevitable scatter makes it hard to distinguish between alternative normalizations.
To avoid this, Brown (1980) [11] and Ashby and Brown (1981) [12] measured the Vickers hardness H (MN/m2) of single crystals of some 25 elements and compounds, forming seven distinct groups, over a wide range of temperature. The samples were, as nearly as possible, in a standard state of purity and history. Fig. 18.1 shows an example: in it, the hardnesses of nine alkali halides are plotted against temperature from 88 K to about 1000 K. At a given temperature, the hardness range is about a factor of 35.
Ashby and Brown then investigate the effect of normalizing these data in the various ways listed in Table 18.2. The data for each group of materials were replotted on normalized axes, a curve fitted to them, and the mean square deviation from the curve was used to measure the success of the normalization. Fig.18.2 shows the data for the alkali halides after the normalization H/μ and T/TM.
Some normalizations for the temperature are not successful. Normalizing by the Debye temperature Tθ (to form T/Tθ), for example, increases the spread of the data. In every case the best correlation is given by normalizing temperature by the melting point, TM, although the use of EΩ/k or μΩ/k (where Ω is the atomic or molecular volume) is almost as good. This is because the normalizing parameters are not independent. In particular, the moduli and the melting point are correlated for many elements and compounds. Fig. 18.3 shows the correlation which, to a good approximation, is described by:
|
|
(18.1) |
and
|
|
(18.2) |
(where E0 and μ0 are the values of E and μ at 300 K). This is important, since models for plasticity (Kocks et al., 1975 [5]) suggest the normalization kT/μΩ rather than T/TM for temperature. The correlation makes TM an acceptable substitute for μΩ/k, and an exceedingly convenient one, since the range for which the material is solid is then spanned by range 0 < T/TM < 1.
The best normalization
for the stress or the hardness is by the cohesive energy (∆Hc/Ω). Applying it to the data
for the alkali halides gives a scatter, as measured by a correlation
coefficient, which is only slightly greater than that within data for a single
alkali halide. Certain other normalizations are almost as good. For
cubic materials, normalization by ![]() works tolerably well. Normalization by a mean Young's
modulus is better and has the advantage that only the bare minimum of data (E,
TM) are necessary to perform it. The cohesive energy, despite
its good performance, is not attractive for general use: it is hard to measure,
and is not known for many compounds for which mechanical data exist; a modulus,
though slightly less good, is much more convenient. We chose to use
μ because dislocation theory suggests
that, in many cases, strength should scale as the line energy of a glide
dislocation, and (for a screw) this is a proportional to
μ.
works tolerably well. Normalization by a mean Young's
modulus is better and has the advantage that only the bare minimum of data (E,
TM) are necessary to perform it. The cohesive energy, despite
its good performance, is not attractive for general use: it is hard to measure,
and is not known for many compounds for which mechanical data exist; a modulus,
though slightly less good, is much more convenient. We chose to use
μ because dislocation theory suggests
that, in many cases, strength should scale as the line energy of a glide
dislocation, and (for a screw) this is a proportional to
μ.
When data for groups of oxides and of elements are analysed in the same way, it is again found that the normalizations by μ and TM (or by E and TM) bring the hardnesses of members of one group onto a single master curve and distinguish them from those of other groups. This success suggests a less laborious way of identifying isomechanical groups. It is discussed in the next section.
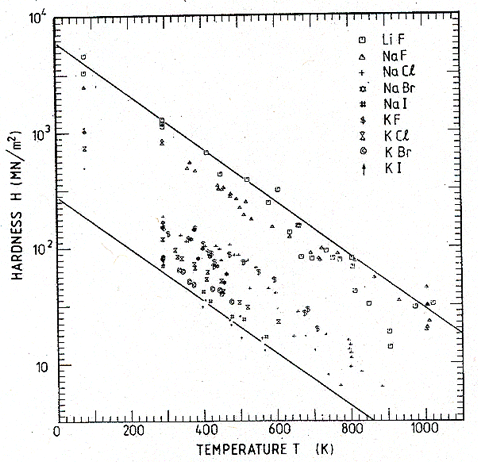
Fig.18.1. The Vicker's hardness H of nine alkali halides in, as nearly as possible, the same structural state, plotted against temperature.
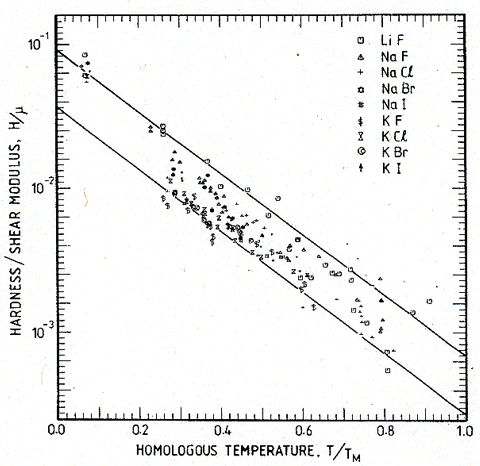
Fig.18.2. The data of Fig.18.1, replotted on the normalized axes H/μ and T/TM. The spread of data is reduced from a factor of 25 to a factor of 2.5. A plot on axes of HΩ/∆Hc and T/TM is even more successful, but less convenient to use.
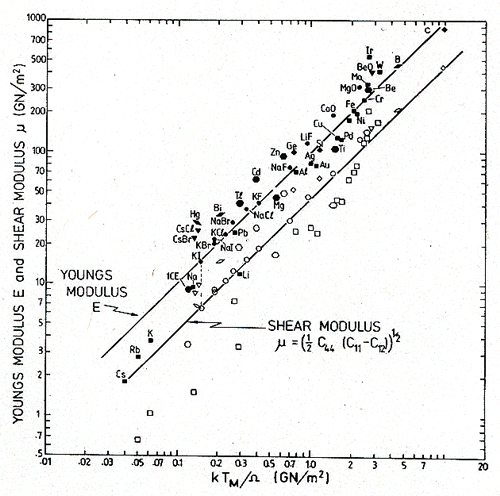
Fig. 18.3. The correlation between the melting temperatures and Young's moduli and the shear moduli of polycrystals.
Chapter 2 described simple models for the mechanism of plastic flow. Each mechanism was described by a constitutive law of the form (Chapter 1, eqn. (1.1)):
|
|
(18.3) |
Here, it will be remembered, Si is a set of state variables which describe the microstructural state of the materials (its dislocation density, grain size, cell size, etc.) and Pj is a set of material properties (bond energies, moduli, diffusion constants, and so forth) which are constant for a given material, but, of course, differ from one material to another.
If we choose a set of
normalizing parameters,
σ*, T*, ![]() *, with the dimensions of stress, temperature and strain
rate, the constitutive law can be written:
*, with the dimensions of stress, temperature and strain
rate, the constitutive law can be written:
|
where |
(18.5) |
The quantities ![]() and
and ![]() are normalized,
dimensionless state variables and material properties. It now follows that if
the normalizing parameters,
σ*,
T* and
are normalized,
dimensionless state variables and material properties. It now follows that if
the normalizing parameters,
σ*,
T* and ![]() bring
together data from a given group of materials, in an equivalent microstructural
state (
bring
together data from a given group of materials, in an equivalent microstructural
state (![]() the same), thereby causing them to lie on a single master curve:
the same), thereby causing them to lie on a single master curve:
|
|
(18.6) |
then the dimensionless material
properties ![]() must
be constants for the members of that group.
must
be constants for the members of that group.
The approach is most easily understood through an example. At high temperatures and low stresses, diffusional flow can become the dominant deformation mechanism (Chapter 2, Section 2.5). When lattice diffusion limits the creep rate, this rate (eqn. (2.29)) is given by:
|
|
(18.7) |
This equation has the form of eqn.
(18.3): it relates the macroscopic variables (![]() ,
σs, T) to the structure (the grain
size, d ) and to material properties (atomic volume,
Ω, and lattice diffusion constants D0υ and Qυ). Normalizing by
μ and TM gives:
,
σs, T) to the structure (the grain
size, d ) and to material properties (atomic volume,
Ω, and lattice diffusion constants D0υ and Qυ). Normalizing by
μ and TM gives:
|
|
(18.8) |
|
or |
(18.9) |
where ![]() . Here DTM, is
the diffusion coefficient at the melting point and the strain‑rate has
been normalized by
. Here DTM, is
the diffusion coefficient at the melting point and the strain‑rate has
been normalized by ![]() to give
to give ![]() . The normalized stress is
. The normalized stress is
![]() and
normalized temperature is
and
normalized temperature is ![]() .
.
This is a relationship
between ![]() ,
and T and
,
and T and ![]() . Members of a group of materials,
in the same microstructural state
. Members of a group of materials,
in the same microstructural state ![]() , now have coincident diffusional creep
behaviour if the properties
, now have coincident diffusional creep
behaviour if the properties ![]() and
and ![]() are constants for that group. So we
obtain a second, quite separate, indicator of a good choice of normalizing
parameter by examining how nearly constant the quantities
are constants for that group. So we
obtain a second, quite separate, indicator of a good choice of normalizing
parameter by examining how nearly constant the quantities ![]() and
and ![]() are.
are.
They are plotted in
Figs.18.4 and 18.5 (data from standard sources; see also Brown and Ashby, 1980a
[13]). The value of each, for a given group of materials,
has a narrow range, and the values for different groups are distinct. In
addition, the normalizing parameter ![]() (which measured the atomic
jump frequency at the melting point) is shown in Fig. 18.6. It, too, has a
characteristic value for each group.
(which measured the atomic
jump frequency at the melting point) is shown in Fig. 18.6. It, too, has a
characteristic value for each group.
Diffusional flow may involve boundary diffusion also. If the full constitutive law (eqn. (2.29) with eqn. (2.30)) is normalized as before, two new material parameters appear:
|
|
where D0υ and D0b are the pre‑exponentials for
each diffusion path and Qb is the activation energy
for boundary diffusion. Data are available for some 15 materials, but they are
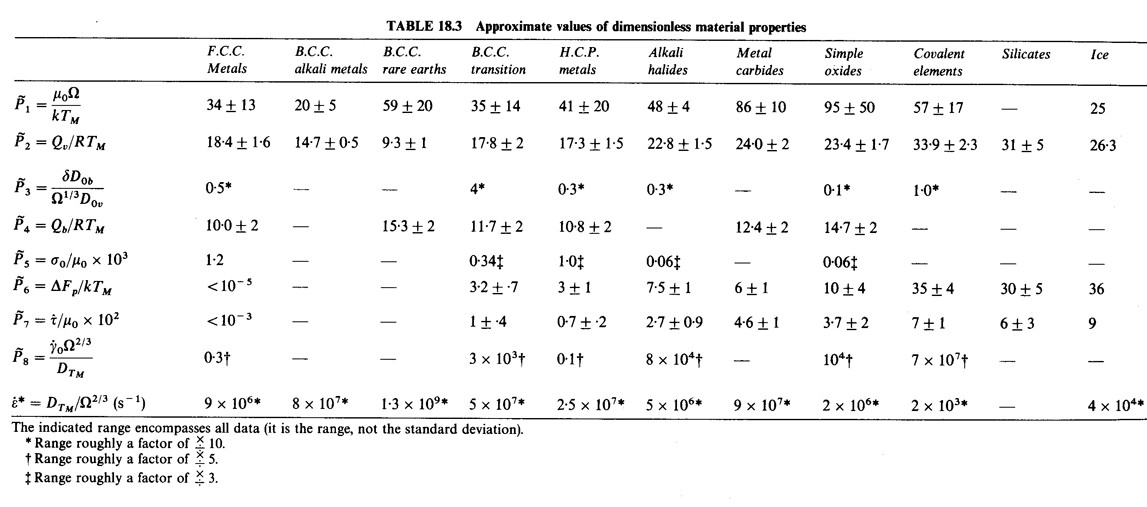
inadequate to construct plots like Figs. 18.4 and 18.5. Instead we tabulate
the parameter ![]() and
the ratio
and
the ratio ![]() (Table
18.3; data from Brown and Ashby, 1980a [13]). Both are roughly constant. As with
(Table
18.3; data from Brown and Ashby, 1980a [13]). Both are roughly constant. As with ![]() and
and ![]() , each group of
materials has characteristic values of
, each group of
materials has characteristic values of ![]() and
and ![]() , which distinguish it from
the other groups.
, which distinguish it from
the other groups.
A similar procedure can be applied to power‑law creep (Chapter 2, Section 2.4). At high temperatures, creep is frequently (though not always) limited by lattice diffusion. Then (eqn. (2.21)) its rate is:
|
|
(18.10) |
This is the most difficult constitutive law with which to deal because, although the creep exponent n is roughly constant for pure elements and compounds (generally n = 4 ± 1), the creep "constant" A varies by many orders of magnitude. This difficulty with the creep equation has been examined by Brown and Ashby (1980b) [14] who rewrite the equation as:
|
|
where σ0 is a material property. When σ0 is properly defined it is found to be approximately constant for a given class of material; and with this value of σ0 , the dimensionless quantity A3 is a constant also (its value is approximately 1.6 x 10‑6).
Normalizing by σ0 and TM gives:
|
|
(18.11) |
where (as before) ![]() ,
, ![]() and
and ![]() and
and ![]() and
and ![]() were defined earlier.
Although the equation contains three dimensionless material properties, only
one is new: it is the quantity
were defined earlier.
Although the equation contains three dimensionless material properties, only
one is new: it is the quantity ![]() . Reliable data for it are sparse; the best estimates we can make
are given in Table 18.3 (Brown and Ashby, 1980b [14]).
. Reliable data for it are sparse; the best estimates we can make
are given in Table 18.3 (Brown and Ashby, 1980b [14]).
Finally, low‑temperature plasticity (Chapter 2, Section 2.2) is described by a rate equation of the general form:
|
|
(18.12) |
Here
∆F is the activation energy for glide, for either
lattice‑resistance or obstacle control. The preexponential ![]() has the
dimensions of strain‑rate, and
has the
dimensions of strain‑rate, and ![]() , the flow strength at 0 K, has the
dimensions of stress. The function f is unimportant; it is commonly of
the form:
, the flow strength at 0 K, has the
dimensions of stress. The function f is unimportant; it is commonly of
the form:
|
|
Normalizing by (μ, TM) as before, leads to three new dimensionless properties:
|
|
Their approximate values for various material groups, for lattice‑resistance controlled glide, are given in Table 18.3.
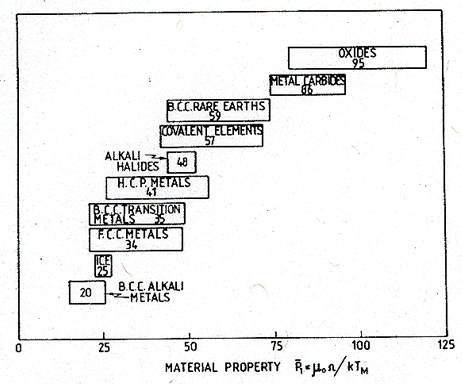
Fig. 18.4. The ranges of the dimensionless quantity μ0Ω/kTM for classes of solids.
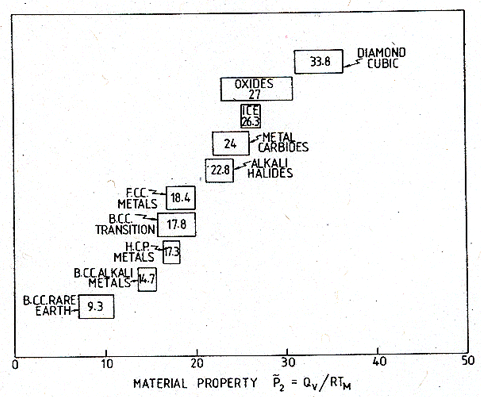
Fig. 18.5. The ranges of the dimensionless quantity Qυ/RTM for classes of solids.
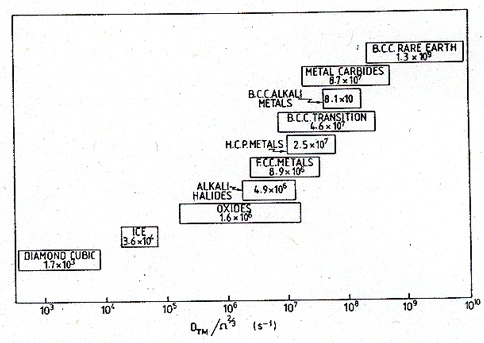
Fig.
18.6. The ranges of the quantity ![]() (s-1) for classes of solids.
(s-1) for classes of solids.
Both the investigation of scaling (Sections 18.2 and 18.3) suggest that materials can be classified into isomechanical groups. The members of a group are mechanically similar, and by proper scaling their mechanical properties can be brought, more or less, into coincidence. The same scaling separates and distinguishes this group from other groups.
The f.c.c. metals form an isomechanical group. So, too, do the diamond cubic elements. But it is not just the structure which determines mechanical strength. Rock‑salt structured materials, for example, fall into four separate mechanical groups (Table 18.1). The tonically bonded alkali halides form one such group. But they are quite distinct from the transition‑metal carbides and from the rock‑salt structured oxides; and in ways that do not relate simply to the modulus and the melting point. The b.c.c. metals provide a second example. The data plotted in Figs.18.4, 18.5 and 18.6 show a clear differentiation into three isomechanical groups: the alkali metals, the transition metals and the lanthanides.
It is necessary, then, to divide materials according to both structure and bonding if mechanical behaviour is to be grouped. But the groups are still large ones. A first attempt at this classification for elements and simple compounds is shown in Table 18.1.
The systematic examination of scaling relations for mechanical behaviour summarized above shows that when stress, temperature and strain‑rate are appropriately normalized, materials of the same structure and bonding, in the same microstructural state (grain size, purity, state of work‑hardening and so forth) can be described by a single masterdiagram. Successful normalizations bring data for members of a given isomechanical group together, and distinguish them from other groups.
This is because, in the
broadest sense, mechanical behaviour is governed by a set of dimensionless
material properties ![]() . The values of
. The values of ![]() are
essentially constant for each isomechanical group—meaning solids with the same
structure and similar bonding. The most successful normalization for
σ, T and
are
essentially constant for each isomechanical group—meaning solids with the same
structure and similar bonding. The most successful normalization for
σ, T and ![]() is that described by
(∆Hc/Ω, TM,
DTM/Ω2/3), but the
normalizations (μ, TM,
DTM/Ω2/3) or (E,
TM, DTM/Ω2/3) are
almost as good, and much more convenient.
is that described by
(∆Hc/Ω, TM,
DTM/Ω2/3), but the
normalizations (μ, TM,
DTM/Ω2/3) or (E,
TM, DTM/Ω2/3) are
almost as good, and much more convenient.
TABLE 18.4 Progression of material properties
|
|
F.C.C. |
B.C.C./H.C.P. |
Alkali halides |
Simple oxides |
Covalent solids |
|
|
<10‑3 |
1 |
25 |
5 |
7 |
|
|
<10-5 |
3 |
7.5 |
10 |
32 |
|
|
18 |
17 |
23 |
24 |
32 |
The results have certain
applications. First they allow one to see, at a very simple level, how classes
of solids differ, and how the differences arise There is a steady progression
in the mechanical behaviour as the bonding becomes increasingly localized
because this (i) generates an increasing lattice resistance, and (ii) raises
the activation energy for both glide and for diffusion. Table 18.4 summarizes
this progression. Note the increasing values of ![]() ,
, ![]() and
and ![]() as the bonding
changes from metallic to ionic and covalent. It may be objected that material
properties such as the stacking fault energy of f.c.c. crystals, or the c/a
ratio of hexagonal crystals, or the stoichiometry of oxides, have been
neglected in this treatment—and it is true that they have a considerable
influence on a mechanical behaviour. But we are concerned here
with the gross differences between broad classes of solids (the differences
between b.c.c. metals and diamond cubic elements, for instance) and on this
gross scale it is the quantities tabulated here which determine the
characteristics of mechanical behaviour. Such quantities as stacking fault
energy produce smaller variations about these characteristic or baseline
properties.
as the bonding
changes from metallic to ionic and covalent. It may be objected that material
properties such as the stacking fault energy of f.c.c. crystals, or the c/a
ratio of hexagonal crystals, or the stoichiometry of oxides, have been
neglected in this treatment—and it is true that they have a considerable
influence on a mechanical behaviour. But we are concerned here
with the gross differences between broad classes of solids (the differences
between b.c.c. metals and diamond cubic elements, for instance) and on this
gross scale it is the quantities tabulated here which determine the
characteristics of mechanical behaviour. Such quantities as stacking fault
energy produce smaller variations about these characteristic or baseline
properties.
The existence of such isomechanical groups also means that, at an approximate level, the mechanical behaviour can be predicted. Such a need appears in geology and geophysics, and (less often) in materials science and applied physics. Then data for one member of an isomechanical group can be scaled to give some idea of the behaviour of other, less well‑characterized members of the group, provided its modulus and melting point are known. The maps shown in Chapters 4 to 16 can be thought of as typifying the group of solid to which they belong. Thus an approximate but useful description of the behaviour of (for instance) gold can be obtained from the map for copper or nickel, using the normalized axes (Chapter 4); an approximate description of NaI can be obtained from the map for NaCl (Chapter 10); and the mechanical behaviour of PuO2 should be well approximated by that for UO2 (Chapter 13).
1. Dorn, J.E., Creep and Recovery. 1957: ASM, Ohio. 2255.
2. McLean, D. and K.F. Hale, Structural Processes in Creep. 1961, London: Iron and Steel Institute. 86.
3. Bird, J.E., A.K. Mukherjee, and J.F. Dorn, Correlations Between High-Temperature Creep Behaviour and Structure, D.G.a.R. Brandon, A., Editor. 1969, Haifa University Press, Israel. p. 255-341.
4. Sherby, O.D. and P.M. Burke, Mechanical behavior of crystalline solids at elevated temperature. Prog. Mat. Sci., 1967. 13: p. 325.
5. Kocks, U.F., A.S. Argon, and M.F. Ashby, Prog. Mat. Sci., 1975. 19: p. 1.
6. Sherby, O.D. and P.E. Armstrong, Prediction of activation energies for creep and self-diffusion from hot hardness data. Met. Trans., 1971. 2: p. 3479.
7. Chin, G.Y., et al., Hardness, yield strength and young's modulus in halide crystals. Scripta Metallurgica, 1972. 6: p. 475-80.
8. Sherby, O.D. and M.T. Simnad, Prediction of atomic mobility in metallic systems. Trans. ASM., 1961. 54: p. 227.
9. Sherby, O.D. and P.M. Burke, Prog. Mat. Sci., 1967. 13: p. 1.
10. Ashby, M.F. and H.J. Frost, eds. Constitutive Relations in Plasticity. ed. A. Argon. 1975, MIT Press. 116.
11. Brown, A.M., The Temperature Dependence of the Vickers Hardness of Isostructural Compounds. 1980, University of Cambridge.
12. Ashby, M.F. and A.M. Brown. On Deformation of polycrystals. in Proc. 2nd RisØ Int. Symp. on the Deformation of Polycrystals. 1981.
13. Brown, A.M. and M.F. Ashby, Correlations for diffusion constants. Acta Metallurgica (pre 1990), 1980a. 28: p. 1085.
14. Brown, A.M. and M.F. Ashby, On the power-law creep equation. Scripta Metallurgica (before 1990), 1980b. 14: p. 1297.


