THE HEXAGONAL METALS: Zn, Cd, Mg AND Ti
6.1 General Features of the Mechanical Behaviour of Hexagonal Metals
6.2 Origins of the Data for Hexagonal Metals
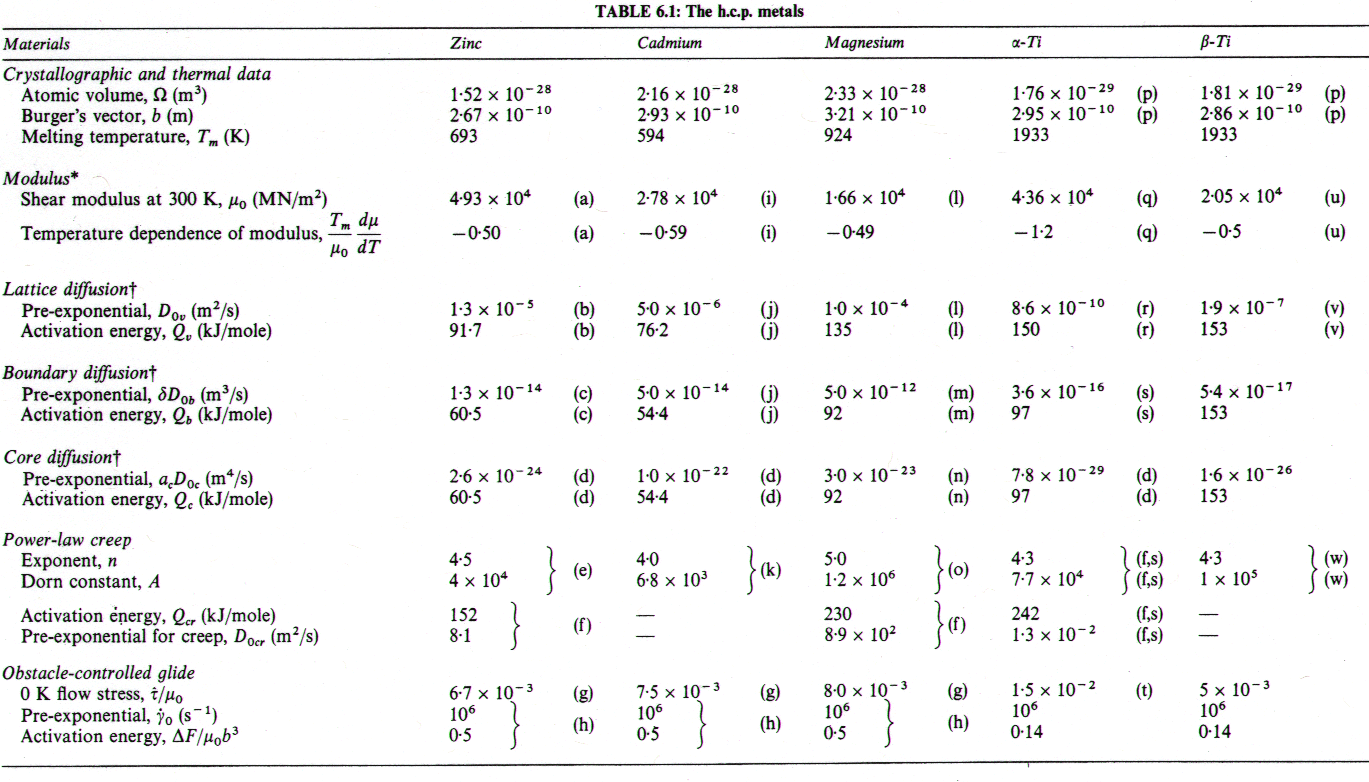
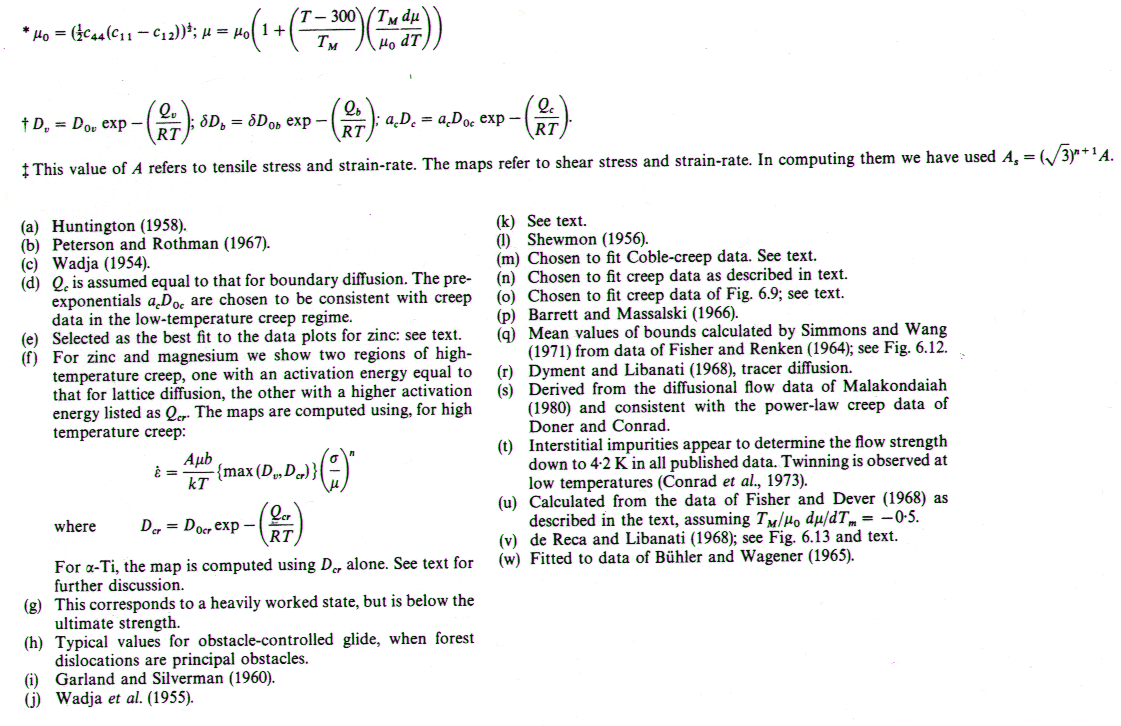
THE HEXAGONAL metals form the basis of a range of industrial alloys of which those based on magnesium, on zinc and on titanium are the most familiar. These metals and alloys resemble the f.c.c. metals in many regards, but their structure, though close-packed, is of lower symmetry. This necessitates new modes of slip, some of which are opposed by a considerable lattice-resistance, making them more prone to twinning and to cleavage fracture. Maps and data for four of them (Zn, Cd, Mg and Ti) are shown in Figs. 6.1 to 6.13. The parameters used to compute the maps are listed in Table 6.1.
|
6.1 GENERAL FEATURES OF THE MECHANICAL BEHAVIOUR OF HEXAGONAL METALS |
The
maps we show here for the hexagonal metals resemble somewhat those for the
f.c.c. metals. The fields of plasticity, power-law creep and diffusional flow
are of the same general size, though they are displaced to slightly higher stresses.
The h.c.p. metals differ from the f.c.c. in two regards. First, twinning is
much somewhat those for the f.c.c. metals. The fields of plasticity, power-law
creep and more prevalent, becoming an important mode of deformation at low
temperatures. And second, the low symmetry means that at least two different
classes of slip system must operate for polycrystal plasticity. Three of the
metals considered here (Zn, Cd and Mg) have c/a ratios which are greater than
16, and slip most easily on the basal plane (0001), with no measurable lattice
resistance; but the concomitant prismatic or pyramidal slip, or twinning, all
require that at low temperatures a lattice resistance of general magnitude 5 x
10-3 µ must be overcome. Ti, like Zr and Hf. has a c/a ratio of less
than 1.6, and slips most easily on the prism planes ( ); the
lattice resistance on the basal and pyramidal planes is larger. In all h.c.p.
metals this lattice resistance falls with increasing temperature (like that of
the b.c.c. metals) until it is obscured by obstacle-strengthening
associated with work-hardening. A satisfactory theoretical treatment and
rate-equation for macroscopic plasticity involving coupled slip on
dissimilar systems is not at present available. We have avoided the difficulty
by presenting maps for heavily worked polycrystals, such that work-hardening
determines the flow strength at all temperatures—that is why they resemble
those for f.c.c. metals.
At very high temperatures (< 0.8 TM) there is evidence, for Zn, Cd and Mg, for a creep field of anomalously high activation energy. It is generally explained as a result of a rapid drop in the resistance to shear on non-basal systems, though it may simply reflect the onset of dynamic recrystallization. The mechanism is not yet clear; but since it results in important changes in strength, we have included it in an empirical way, as described in the text (Section 6.2 and in note (f) of Table 6.1).
The maps for Ti (Figs. 6.10, 6.11 and 17.4) are divided at the phase boundary (1115 K; 0.6 TM) into two parts. There is a discontinuity in strain-rate at the phase boundary; at high stresses the creep-rate increases (by a factor of about 10) on transforming from α- to β-Ti; at low stresses it decreases. Because of this, the strain-rate/stress map (Fig. 6.11) has an inaccessible region (heavily shaded) and an overlapping region (broken field boundaries) separating the two phases.
Ti resembles Hf and Zr in having low shear moduli in certain planes, an unexpectedly low diffusion coefficient in the h.c.p. α-phase, and anomalous diffusion in the b.c.c. β-phase, suggesting an activation energy which increases with temperature. Power-law creep in both α-Ti and α-Zr has an activation energy which is larger, by a factor of about 2, than that for lattice diffusion. There is no satisfactory explanation for this at present; it may be related to the requirement of slip on two (or more) dissimilar slip systems for polycrystal plasticity. The activation energy for creep in β-Ti is close to that for self-diffusion.
One consequence of the anisotropic lattice resistance in these metals is that texture has an unusually profound effect on strength. Textured, extruded zinc, for example, creeps (under a given load) at rates which differ by a factor of 100 in the longitudinal and transverse direction (Edward's et al., 1974) [1] a much larger factor than that found for f.c.c. or b.c.c. metals. Some of the scatter in the data may derive from texture differences between samples. Strictly, a given map describes only a particular texture, tested in a particular direction.
The lattice diffusion coefficients of the h.c.p. metals depend only slightly on direction. We have used that for diffusion parallel to the c-axis. The parameters are sufficiently well established that diffusion plots like those shown for the b.c.c. metals are unnecessary for all but Ti.
Further data and maps for Ti can be found in Chapter 17, Section 17.2. The field of drag controlled plasticity, visible on Fig. 6.10, is explained there.
6.2 ORIGINS OF THE DATA FOR HEXAGONAL METALS
Fig. 6.1 shows a map for zinc with a grain size of 0.1 mm. It is based on the data plotted in Figs. 6.2 and 6.3, and summarized in Table 6.1.
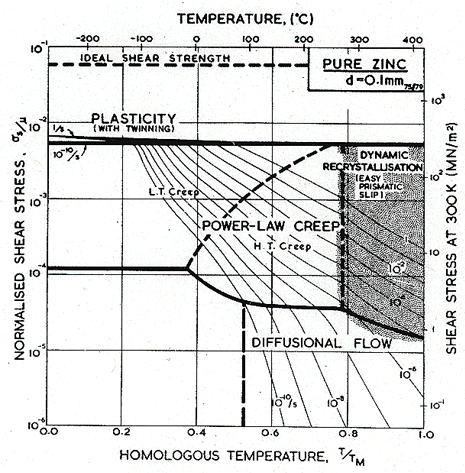
Fig. 6.1. Pure zinc with a grain size of 0.1 mm.
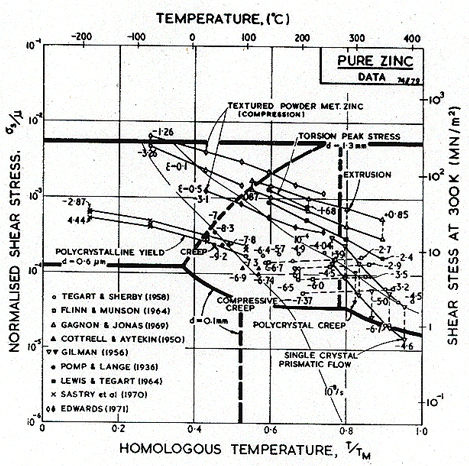
Fig. 6.2. Data
for zinc, divided into blocks. The numbers are log10 (![]() )
)
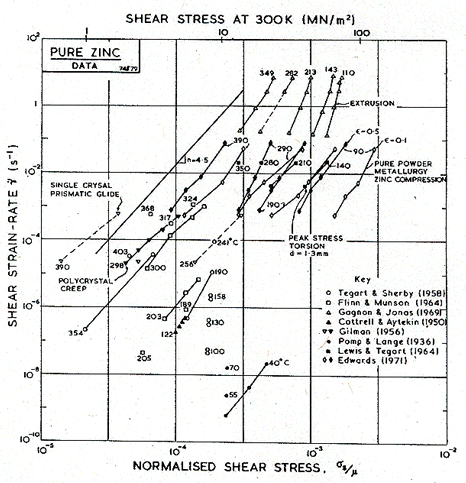
Fig. 6.3. Creep data for pure zinc, labelled with the temperature in °C.
The creep field is based primarily on the work of Tegart and Sherby (1958) [2] and of Flinn and Munson (1964) [3]. Both groups found unexpectedly high activation energies at temperatures above 0.8 TM: Flinn and Munson report that, above 270°C, the activation energy for creep, Qcr, is about 152 kJ/mole; above 350°C Tegart and Sherby found 159 kJ/mole (compared with about 92 kJ/mole for lattice diffusion). Both groups report a slightly lower value of n for the high-temperature regime. We have used two power-laws (Table 6.1, note f) and have employed the value Qcr = 152 kJ/mole for the upper part, and 92 kJ/mole for the lower part of the high-temperature creep field, and used n = 4.5 for both. This combination leads to a map which fits well the plots of the experimental data shown as Figs.6.2 and 6.3. The higher activation matches the value,159 kJ/mole, found by Gilman (1956) [4] for prismatic glide in single crystals of zinc, and for that reason this high-temperature region is often attributed to easy prismatic slip. We think it is more likely that it is a consequence of dynamic recrystallization (Section 2.4), which usually raises the apparent activation energy for creep.
Figs. 6.2 and 6.3 include the data of Edwards (1971) [5] for powder-metallurgy zinc containing 1.2 vol.% of ZnO. Edwards reported an activation energy of 54-59 kJ/mole at low temperatures (0.5 to 0.6 TM) and a larger energy of 113 kJ/mole at higher temperatures (0.8 to 0.95 TM). We have assumed that the lower activation energy reflects a contribution of core diffusion; there are, however, no data for pure zinc which clearly lie in the low-temperature regime.
Fig. 6.4 shows a map for cadmium with a grain size of 0.1 mm. It is based on the data plotted in Figs. 6.5 and 6.6, and summarized in Table 6.1.
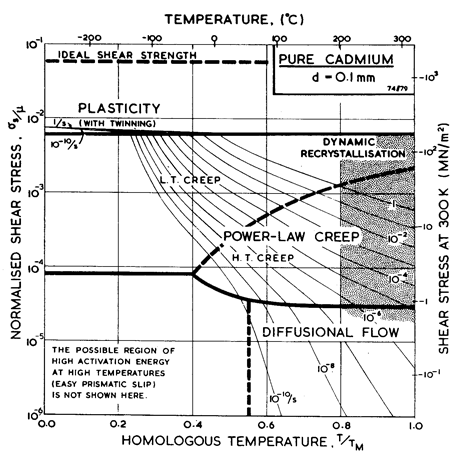
Fig. 6.4. Pure cadmium with a grain size of 0.1 mm.
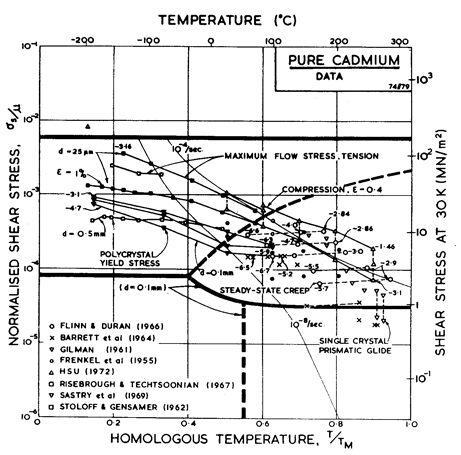
Fig. 6.5.
Data for cadmium divided into blocks. The numbers are logl0 (![]() )
)
We have derived the low-temperature plasticity and the creep parameters from the more recent compression tests of Hsu (1972) [6] (Figs. 6.5 and 6.6). His tests on cast cadmium showed strain softening which appears on our Figures as a difference between the peak stress and that at a tensile strain, ε, of 0.4. We have adjusted the parameters of the rate-equations to match the peak stress. At high temperatures the activation energy observed by Hsu, 75-84 kJ/mole, matches that for lattice self-diffusion (76 kJ/mole). At lower temperatures he found 40-60 kJ/mole, suggesting core diffusion (54 kJ/mole).
There is some suggestion of a high-temperature sub-field, controlled by prismatic glide, or reflecting dynamic recrystallization, like that shown on the map for zinc. Flinn and Duran (1966) [7] for instance, report a regime above 150°C in which Qcr is about 127 kJ/mole, and a regime at a somewhat lower temperature in which it is about 87 kJ/mole. Hsu's work, however, does not explicitly support such a subdivision.
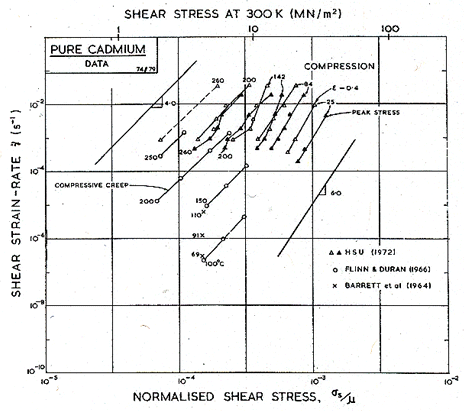
Fig.6.6. Creep data for pure cadmium, labelled with the temperature in °C.
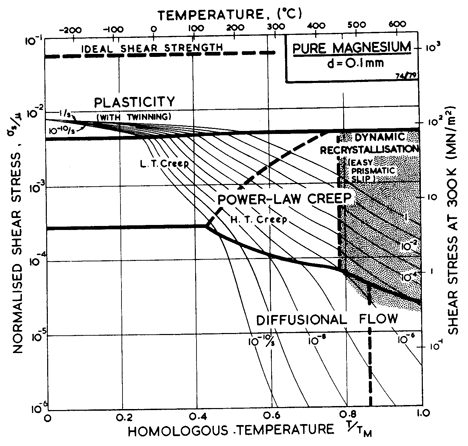
Fig. 6.7. Pure magnesium with a grain size of 0.1 mm.
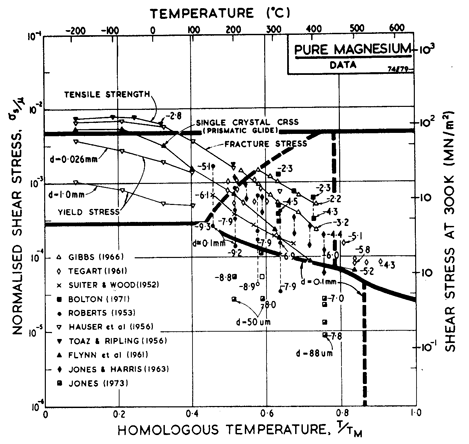
Fig. 6.8.
Data for magnesium, divided into blocks. The numbers are logl0
(![]() )
)
Fig. 6.7 shows a map for magnesium with a grain size of 0.1 mm. It is based on data shown in Figs. 6.8 and 6.9 and summarized in Table 6.1.
The parameters describing low-temperature plasticity are based on the polycrystal yield data of Toaz and Ripling (1956) [8] and Hauser et al. (1956) [9], and on the single-crystal data of Flynn et al. (1961) [10].
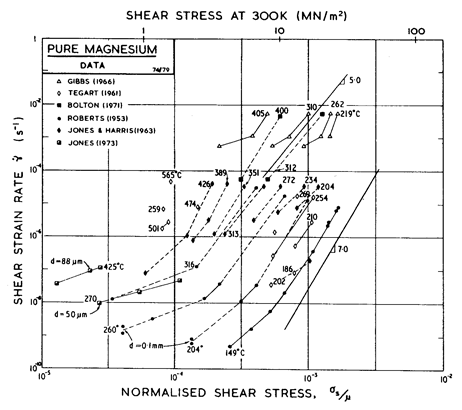
Fig. 6.9. Creep data for magnesium, labelled with the temperature in °C.
In reviewing the creep data for magnesium, Crossland and Jones (1972) [11] found reasonable consistency between published data if that derived from impure magnesium, containing substantial amounts of MgO, was excluded. They concluded that the activation energy for creep was 92 kJ/mole between 0.5 and 0.67 TM, rising to 230 kJ/mole at higher temperatures. We have found, however, that the modulus-corrected data could be equally well described, from 0.5 to 0.78 TM, by a single activation energy: 134 kJ/mole, close to that for self-diffusion. Above 0.78 TM we have used their value of 230 kJ/mole, which is consistent also with data reported by Tegart (1961) [12]; it is generally assumed that this reflects the climb-plus-glide motion of prismatic dislocations (as in zinc), though (as with zinc) it may reflect dynamic recrystallization. We have treated the lower activation energy (92 kJ/ mole) as that of core diffusion which appears in the "low-temperature creep" region of the map.
Crossland and Jones (1972) [11] report stress exponents of n = 5 at low temperatures and n = 10 at high. The larger value appears to be based on data of Jones and Harris (1963) [13] at 0.76 TM; data at the same temperature but lower stresses shows n ~ 4. Tegart (1961) [12] reported n = 5.5 at low temperatures and n = 4 at high. Lacking any sound theoretical basis, we have resolved this conflict by using a single value, n = 5, for both regions (that of lattice-diffusion control, and that of prismatic glide or dynamic-recrystallization control). At lower temperatures the rate-equation for creep (eqn. (2.21)) predicts an increase in the stress exponent which is consistent with the data of Roberts (1953) [14]. The pre-exponential for core diffusion was (in this instance) chosen so that the equation matches Roberts' data at 0.46 TM.
Within the Coble-creep regime, we have chosen values of b D0b and Qb which lead to an approximate fit to published data. Jones (1973) [15] reported an activation energy of 80 kJ/mole, while Crossland and Jones (1972) [11] report 105 kJ/mole. We have used the intermediate value of 92 kJ/mole.
The field of dynamic recrystallization is based on the observations of Gandhi and Ashby (1979) [16].
Figs. 6.10, 6.11 and 17.4 show maps for Ti with a grain size of 0.1 mm. They are based on data plotted on the figures and summarized in Table 6.1. The shear modulus of α-Ti is taken as a mean of the bounds calculated by Simmons and Wang (1971) [17] from the single-crystal data of Fisher and Renken (1964) [18], as shown in Fig. 6.12. We have normalized throughout by the melting point of the β-phase (1934 K); doing so leads to the large normalized temperature dependence of —1.24. (If, instead, Ardell's (1963) [19] estimate for TM for the α-phase, 1957 ± 30 K, based on thermodynamic reasoning, is used, the temperature dependence, —1.12, is still large.) Modulus data for the β-phase are much more limited. Fisher and Dever (1968) [20] give single-crystal constants at 1273 K, from which:
|
|
is found to be 15.3 GN/m2. Assuming a normalized temperature dependent of—0.5, leads to the value of μ0 given in Table 6.1. The anomalously low moduli of both phases reflects their low stiffness with respect to the shear which causes the α→β phase transformation at 1155 K.
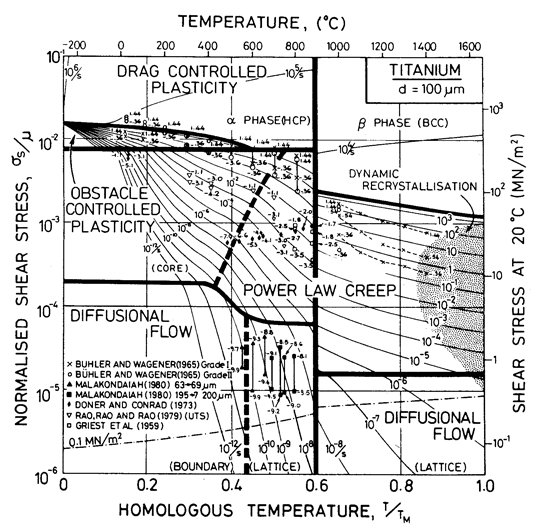
Fig. 6.10. A stress/temperature map for commercially pure titanium with a grain size of 0.1 mm, showing data.
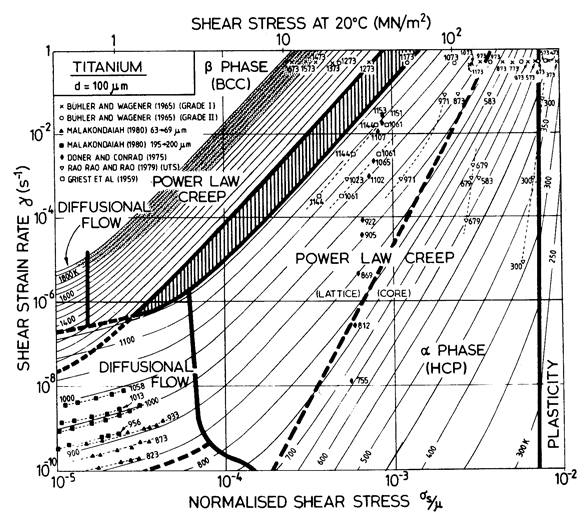
Fig. 6.11. A strain-rate/stress map for commercially pure titanium with a grain size of 0.1 mm, showing data.
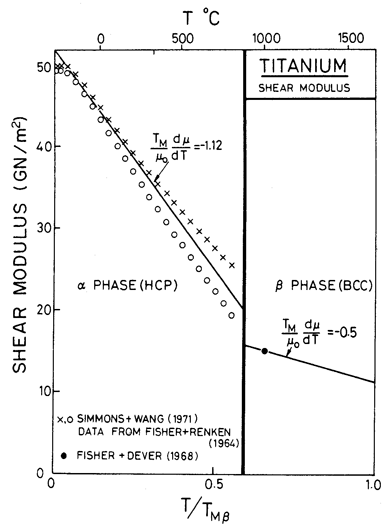
Fig. 6.12. Shear moduli for lilunium.
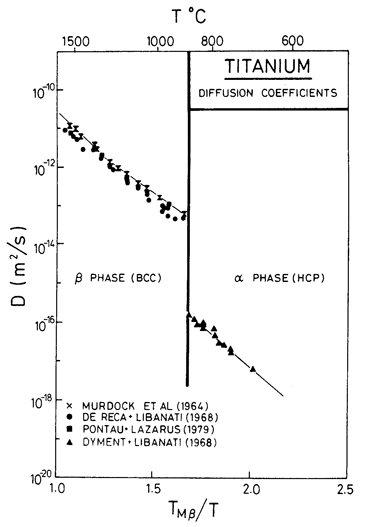
Fig. 6.13. Diffusion data for titanium.
Lattice
diffusion in α-Ti has an
anomalously low activation energy. The normalized value (Qυ/RTM)
typical of h.c.p. metals is 17.3 ± 0.5 (Brown and Ashby, 1980) [21]. The best data for
α-Ti are probably those of Dyment and
Libanati (1968) [22], shown ill Fig. 6.13 who report Qυ = 150.1 kJ/mol, or (using Ardell's estimate of the melting point), Qυ/RTM = 10.3. A low pre-exponential (D0 = 8.6 x 10⁻¹⁰ m/s) partly compensates for this, but the diffusion coefficient at
![]() TM, for example, is still much larger than in most close-packed metals.
Those anomalous values may be because the
α-phase
is only just stable with respect to the more open
β- and
ω-phases;
then the more open structure of the activated state associated with a diffusive
jump has a lower energy than in normal close-packed metals. The low Qυ
and D0υ cannot be reconciled with data for either power-law
creep or for diffusional flow (reviewed below).
TM, for example, is still much larger than in most close-packed metals.
Those anomalous values may be because the
α-phase
is only just stable with respect to the more open
β- and
ω-phases;
then the more open structure of the activated state associated with a diffusive
jump has a lower energy than in normal close-packed metals. The low Qυ
and D0υ cannot be reconciled with data for either power-law
creep or for diffusional flow (reviewed below).
The b.c.c. β-phases of Ti, Zr, and Hf all have non-linear diffusion plots with an activation energy which increases with temperature (see, for example, Murdock et al., 1964) [23]. Sanchez and de Fontaine (1978) [24] explain this as caused by metastable ω-phase embryos which form as the β→α phase boundary is approached; the embryos have a structure like that of the activated state associated with a diffusive jump. The "typical" normalized activation energy (Qυ/RTM) for the b.c.c. transition metals is 17.8 ± 2 (Brown and Ashby, 1980) [21] whereas Murdock et al. report 15.6 at high temperatures falling to 8.1 at the phase boundary (Fig. 6.13). To a tolerable approximation, all the data can be approximated by a single straight line corresponding to an activation energy of 152 kJ/mol (de Reca and Libanati, 1968) [25]. This is the value we have used.
There
are no direct measurements of boundary diffusion in titanium. For
α-Ti, coefficients have been inferred
from diffusional creep data for fine-grained wires (see below). The
anomalously rapid diffusion in β-Ti near the phase
boundary is a consequence of its marginal stability with respect to other competing
structures (α and
ω), so that the grain
boundary, although more open, may not be more permeable. Lacking data, we set
![]() equal to
the mean activation energy for lattice diffusion in the
β-phase, and
equal to
the mean activation energy for lattice diffusion in the
β-phase, and
![]() equal to 2b
times the preexponential for this diffusion.
equal to 2b
times the preexponential for this diffusion.
In analysing the creep data for α-Ti, it is perhaps best to start with the extensive study of Malakondaiah (1980) [26], who tested helical springs of commercial-purity titanium (0.3% oxygen equivalent) in the regime of diffusional flow. Large grained (200-400 µm) samples showed the characteristics of lattice-diffusion control, consistent with Qυ = 242 kJ/mol and D0υ = 1.3 x 10⁻² m2/s (parameters which describe power-law creep well also, see below). Malakondaiah (1980) [26] also tested springs with a fine grain size (63-69 µm) in a relatively low temperature range (832-873 K). The data are consistent with diffusional flow with boundary diffusion control. Assuming this to be so gives Qb = 97 kJ/ mol and D0b = 3.6 x 10⁻¹⁶ m3/s. Data from small-grained specimens above 900 K are inconsistent, perhaps because, at this higher temperature, some grain growth occurred during the test. The diffusional flow field for α-Ti is based on these coefficients. Malakondaiah's data are plotted on Figs. 6.10 and 6.11.
Power-law creep in α-Ti has been studied by Doner and Conrad (1973) [27] and Griest et al. (1959) [28]. Their data, shown in Figs. 6.10 and 6.11, are consistent with an activation energy of 242 kJ/mole, the same as that found for lattice-diffusional creep by Malakondaiah, whose data show an upturn at higher stresses which helps to position the field-boundary between diffusional flow and power-law creep. Doner and Conrad's (1973) [29] estimate of power-law breakdown (for which α' = 300) has been incorporated into the maps, which were computed using eqn. (2.26). Further data of Rao et al. (1979) [30] and of Buhler and Wagener (1965) [31] are consistent with this picture, and give, in addition, an indication of a transition to core-diffusion-controlled power-law creep. This field is based on their data, using the same activation energy as that for boundary diffusional creep, 97 kJ/mol.
Low-temperature plasticity in α-Ti is extremely sensitive to the concentration of the interstitial impurities, H, C, N and O; the flow strength of "commercially pure" α-Ti varies by a factor of 3.5, depending on this concentration (Buhler and Wagener, 1965) [31]. Fig. 16.10 is fitted to data for Buhler and Wagener's (1965) [31] Grade 1 (0.25 wt.% oxygen equivalent) titanium, which is softer than their less-pure Grade 2, but harder than Rao et al.'s (1979) [30] 99. 8 wt.% titanium.
Creep data for β-Ti are more limited. Those of Buhler and Wagener (1965) [31] are shown on Figs.16.10and 16.11; they lie in the regime of power-law breakdown. Assuming α' = 103 (eqn. (2.26)) the data can be fitted by a power of 4.3, and an activation energy equal to the average value obtained from tracer-diffusion studies: 152 kJ/mol. There are no data for diffusional flow; the field is based on the diffusion coefficient of de Reca and Libanati (1968) [25].
1. Edwards, G.R., T.R. McNelly, and O.D. Sherby, Scripta Metallurgica (before 1990), 1974. 8: p. 475.
2. Tegart, W.J.M. and O.D. Sherby, Philosophical Magazine( before 1978), 1958. 3: p. 1278.
3. Flinn, J.E. and D.E. Munson, Philosophical Magazine( before 1978), 1964. 10: p. 861.
4. Gilman, J.J., Trans. AIME, 1956. 206: p. 1326.
5. Edwards, G.R., The Mechanical Behaviour of Powder Metallurgy Zinc and Zinc-Tungsten Particulate Composites. 1971, Stanford University.
6. Hsu, S.-e., The Mechanical Behaviour of Cadmium Base Composites. 1972, Stanford University.
7. Flinn, J.E. and S.A. Duran, Trans. AIME, 1966. 236: p. 1056.
8. Toaz, M.W. and R.E. J., Trans. AIME, 1956. 206: p. 936.
9. Hauser, F.E., P.R. Landon, and J.E. Dorn, Trans. AIME, 1956. 206: p. 589.
10. Flynn, P.W., J. Mote, and J.E. Dorn, Trans. AIME, 1961. 221: p. 1148.
11. Crossland, I.G. and R.B. Jones, Met. Sci. J., 1972(6): p. 162.
12. Tegart, W.J.M., Acta Metallurgica (pre 1990), 1961. 9: p. 614.
13. Jones, R.B. and J.E. Harris. in Proc. of the Joint International Conf on Creep. 1963. London: Inst. Mech. Eng.
14. Roberts, C.S., Trans. AIME, 1953. 197: p. 1021.
15. Jones, R.B.J., Sheffield Unis. Metallurgical Soc., 1973. 12.
16. Gandhi, C. and M.F. Ashby, Acta Metallurgica (pre 1990), 1979. 27: p. 1565.
17. Simmons, G. and H. Wang, in Single Crystal Elastic Constants and Calculated Aggregate Properties. 1971, MIT Press.
18. Fisher, E.S. and C.J. Renken, Physics Review, 1964. 135: p. A482.
19. Ardell, A.J., Acta Metallurgica (pre 1990), 1963. 11: p. 591.
20. Fisher, E.S. and D. Dever, in The Science, Technology and Applications of Titanium, R.I.a.P. Jaffee, N. E., Editor. 1968, Pergamon.
21. Brown, A.M. and M.F. Ashby, Acta Metallurgica (pre 1990), 1980a. 28: p. 1085.
22. Dyment, F. and C.M. Libanati, Journal of Materials Science, 1968. 3: p. 349.
23. Murdock, J.E., T.S. Lundy, and E.E. Stansbury, Acta Metallurgica (pre 1990), 1964. 12: p. 1033.
24. Sanchez, J.N. and D. de Fontaine, Acta Met., 1978. 26: p. 1083.
25. de Reca, N.E.W. and C.M. Libanati, Acta Metallurgica (pre 1990), 1968. 16: p. 1297.
26. Malakondaiah, G. 1980, Banaras Hindu University.
27. Doner, M. and H. Conrad, Met. Trans., 1973. 4: p. 2809.
28. Griest, A.J., A.M. Sabroff, and P.D. Frost, Trans. ASM, 1959. 51: p. 935.
29. Conrad, H., M. Doner, and B. de Meester, in Titanium Science and Technology, R.I.a.B. Jaffee, H. M., Editor. 1973, Plenum Press and TMS-AIME. p. 969.
30. Rao, Y.K.M., V.K. Rao, and P.R. Rao, Scripta Met., 1979. 13: p. 851.
31. Buhler, H.a. and H.W. Wagener, Bänder Bläche Rohre, 1965? 6: p. 677.